This is performance test of Namecheap Shared Hosting. Multiple tests have been done to assess the performance.
Type of Tests:-
- Response time to server (Latency Test)
- Speed test from different locations.
- Google Pagespeed Test
- Google Core Web Vitals Report
- Load Testing by Sending Virtual users.
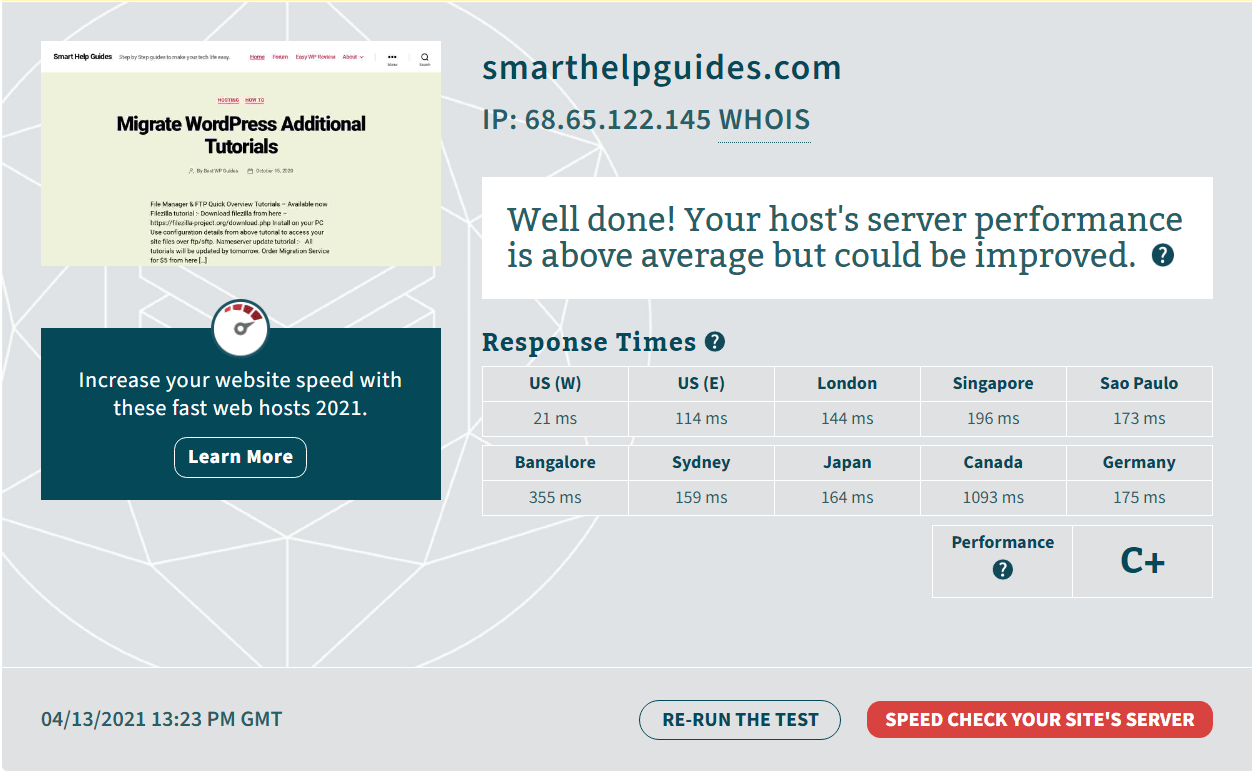
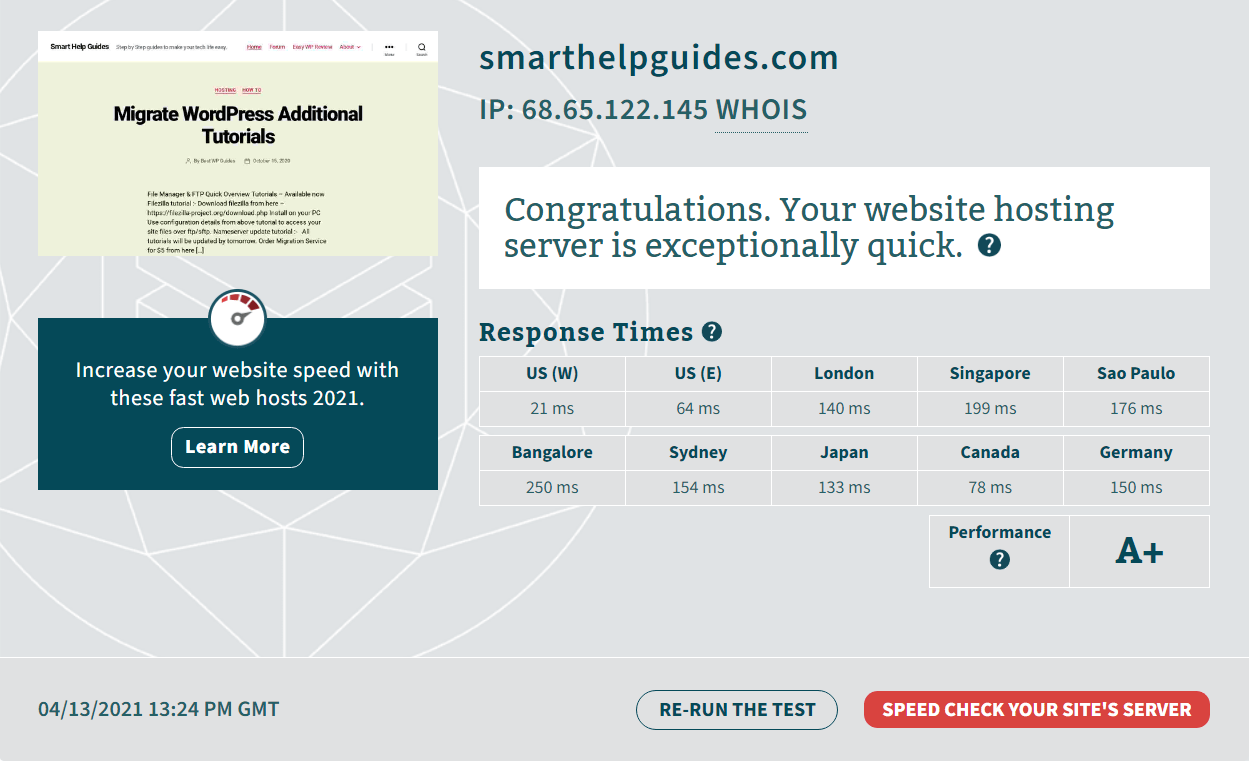
Server Response time (Latency) results
| Response Time (Latency to Server) | ||||||||||
|---|---|---|---|---|---|---|---|---|---|---|
| Location | US(West) | US(east) | London | Singapore | Sao Paulo | Banglore | Sydney | Japan | Canada | Germany |
| Test#1 | 21 | 114 | 144 | 196 | 173 | 355 | 159 | 164 | 1093 | 175 |
| Test#2 | 21 | 64 | 140 | 199 | 176 | 250 | 154 | 133 | 78 | 150 |
| Test#3 | 22 | 67 | 137 | 198 | 170 | 254 | 157 | 126 | 80 | 147 |
| Average | 21.3 | 81.67 | 140.3 | 197.67 | 173 | 286.3 | 156.67 | 141 | 417 | 157.3 |
Source of Table Data – Latency Test1, Latency Test2, Latency Test3
In simple terms this response time means the time required from visitor’s location to your shared hosting server. Results below 50ms is great, till 100ms is good and anything above 150ms is poor.
So, from the above data if your audience is in United States then the response time is great, for all other location it is not very good.
Server location is the most important factor which affect latency results. Namecheap data center is in US only (for UK location you have to pay extra 1USD every month).
Using a CDN service can help to decrease the latency but it you will have pay extra for it and free services like cloudflare may be not very good compared to a premium CDN service.
Many good hosting companies offer multiple server locations so you can host your website on server closet to your audience. Better latency directly affect your website rankings in google.
Speed Test From 3 Locations
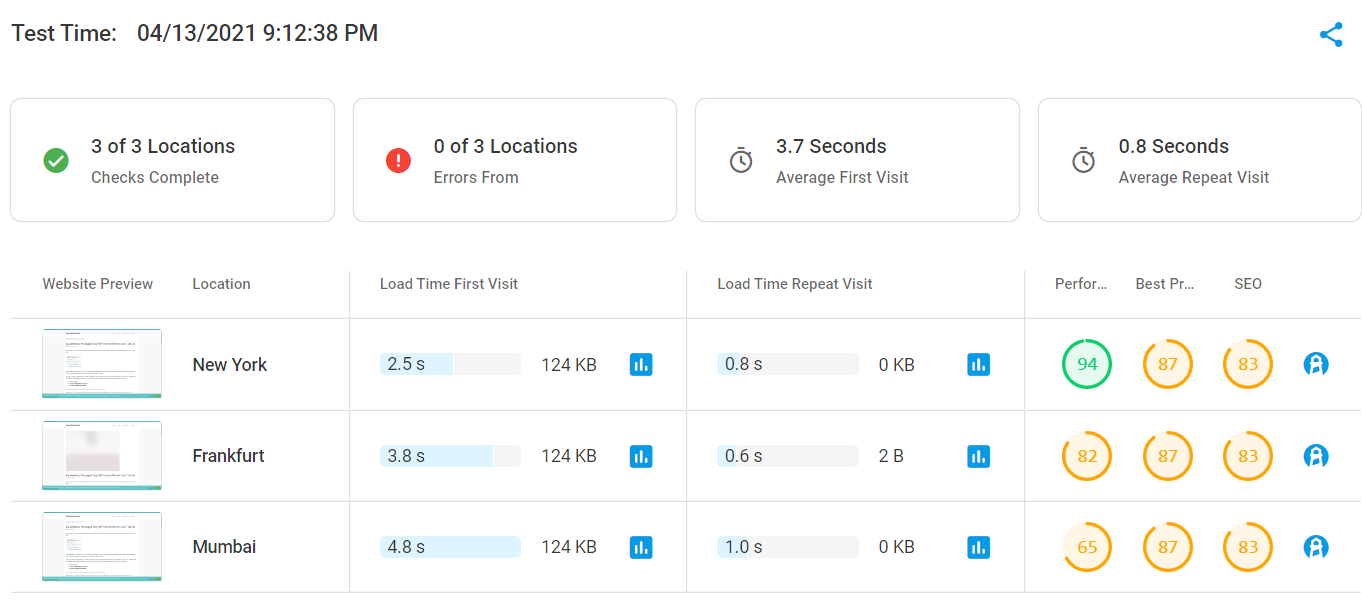
This speed test measures the time it takes to load a page on first visit and on repeat visit. It has been done from 3 different locations and 2 times to get accurate data.
In first test you can see the page size is very low 124KB only and Litespeed caching plugin is also being used to take maximum benefit of server resources and improve page loading time.
Despite best efforts results are very poor for a small page size.
New York – 2.5 seconds
Frankfurt – 3.8 seconds
Mumbai – 4.8 seconds
On repeat visit you will notice a stark difference in page loading time and page size, this is because of the caching and optimizations.
Average page loading time was 3.7 seconds in first test.
For page size 124 KB loading time of page should be <2seconds.
Test 1
Test 2
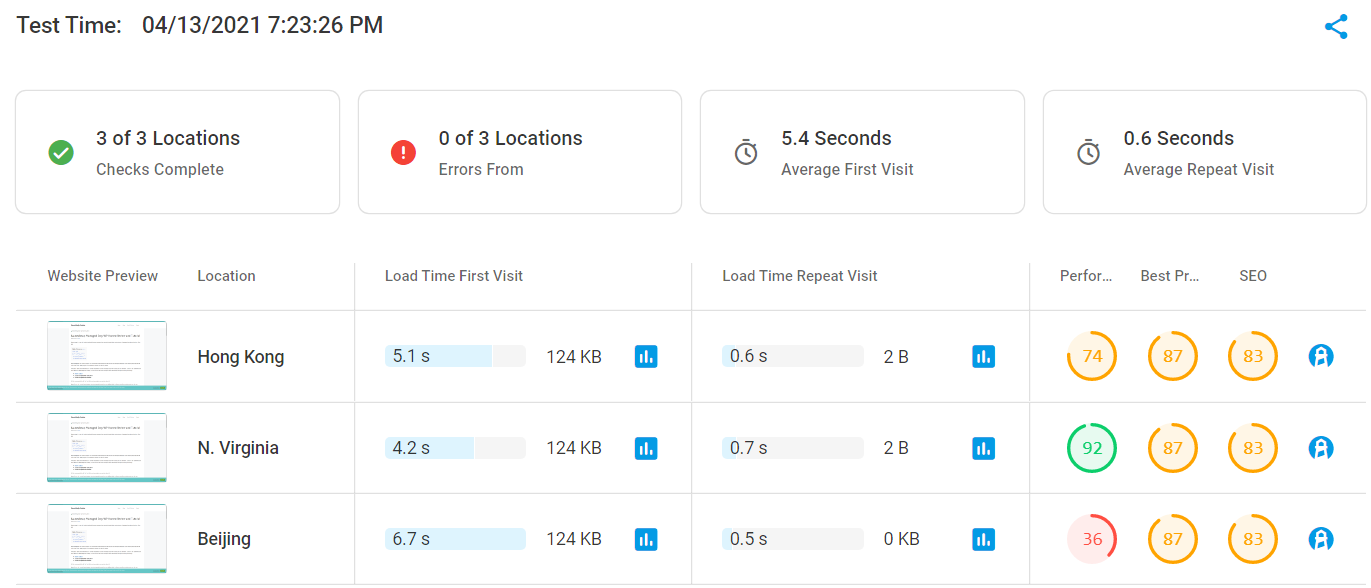
Now again page loading test was performed from multiple locations and you can see the results below.
Hong Kong – 5.1 seconds
N. Virginia – 4.2 seconds
Beijing – 6.7 seconds
Page size is same 124KB
Page loading time on repeat visits again improved a lot because of caching.
Conclusion:- Reason for such poor result is use of old hardware by hosting company. Namecheap is using litespeed servers for their shared hosting which should give them a boost but to provide cheap hosting they have to cut corners and use old hardware. Their Stellar cloud plans will improve loading time but for that price you can get much better hosting at different locations not just limited to US Data centers.
Google PageSpeed Insights
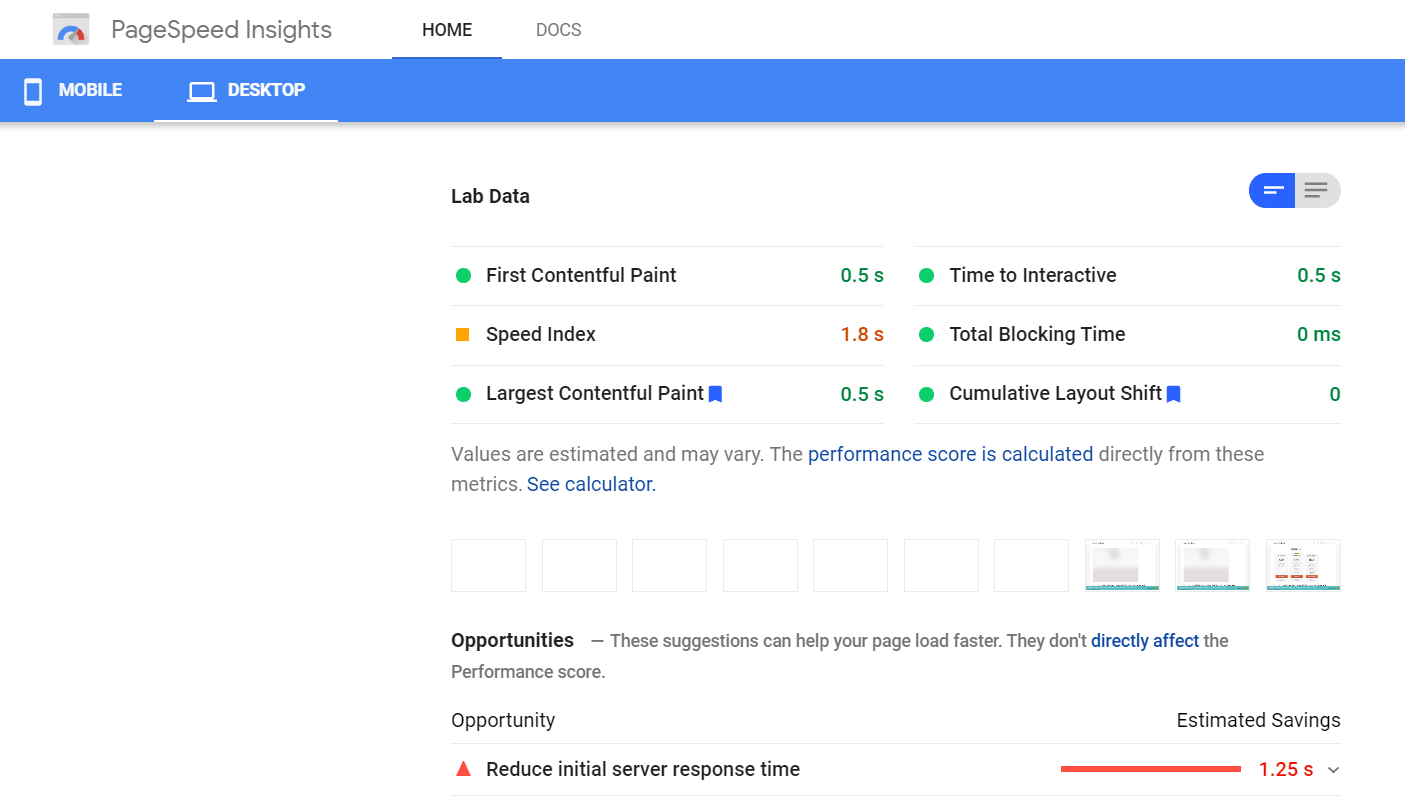
If you watched my video I have shown a live test in which I got 90+ scores for both Mobile and Desktop. So, in lab tests we are getting good results but in real world usage the LCP is way too high while in lab test it is much below the limit of 4 seconds recommended by google.
Test 1
In this test you can see the recommendation is to improve the initial server response time as because of good optimization and caching I have passed 30+ audits.
Server response time again cannot be improved unless you are using good hosting. CDN can be used but from my experience with cloudflare it doesn’t help much and there will be visible lag in browsing website.
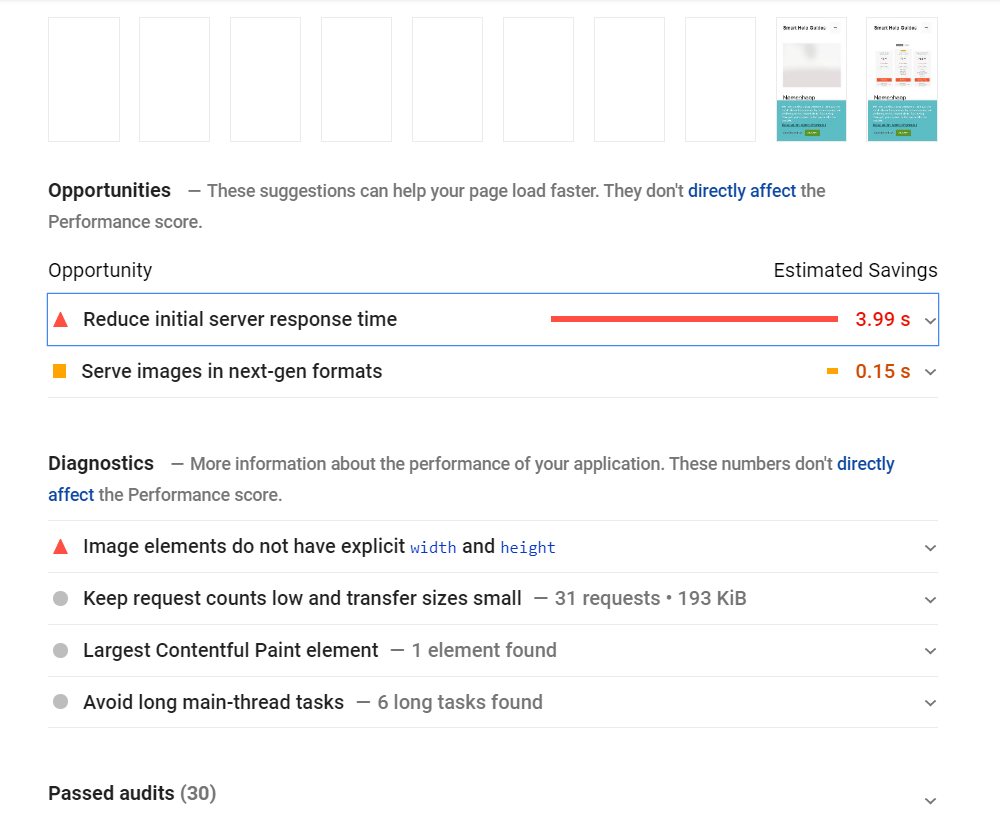
Test 2
I tested again with google pagespeed insight to get accurate data and in second test the response further increased to an unacceptable level of 3.99 seconds.
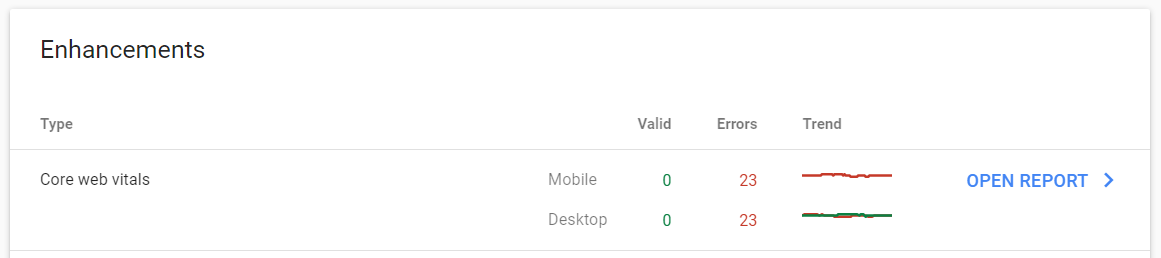
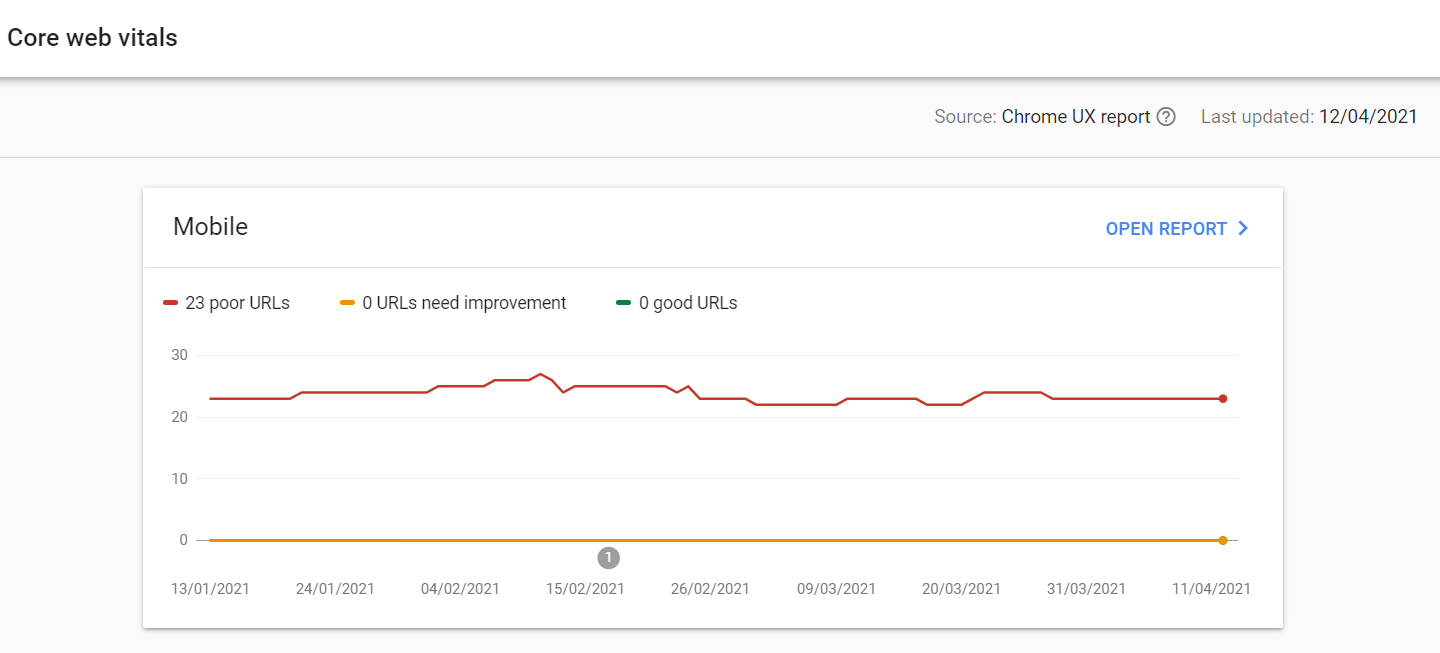
Core Web Vitals Reports (Real User Experience Data)
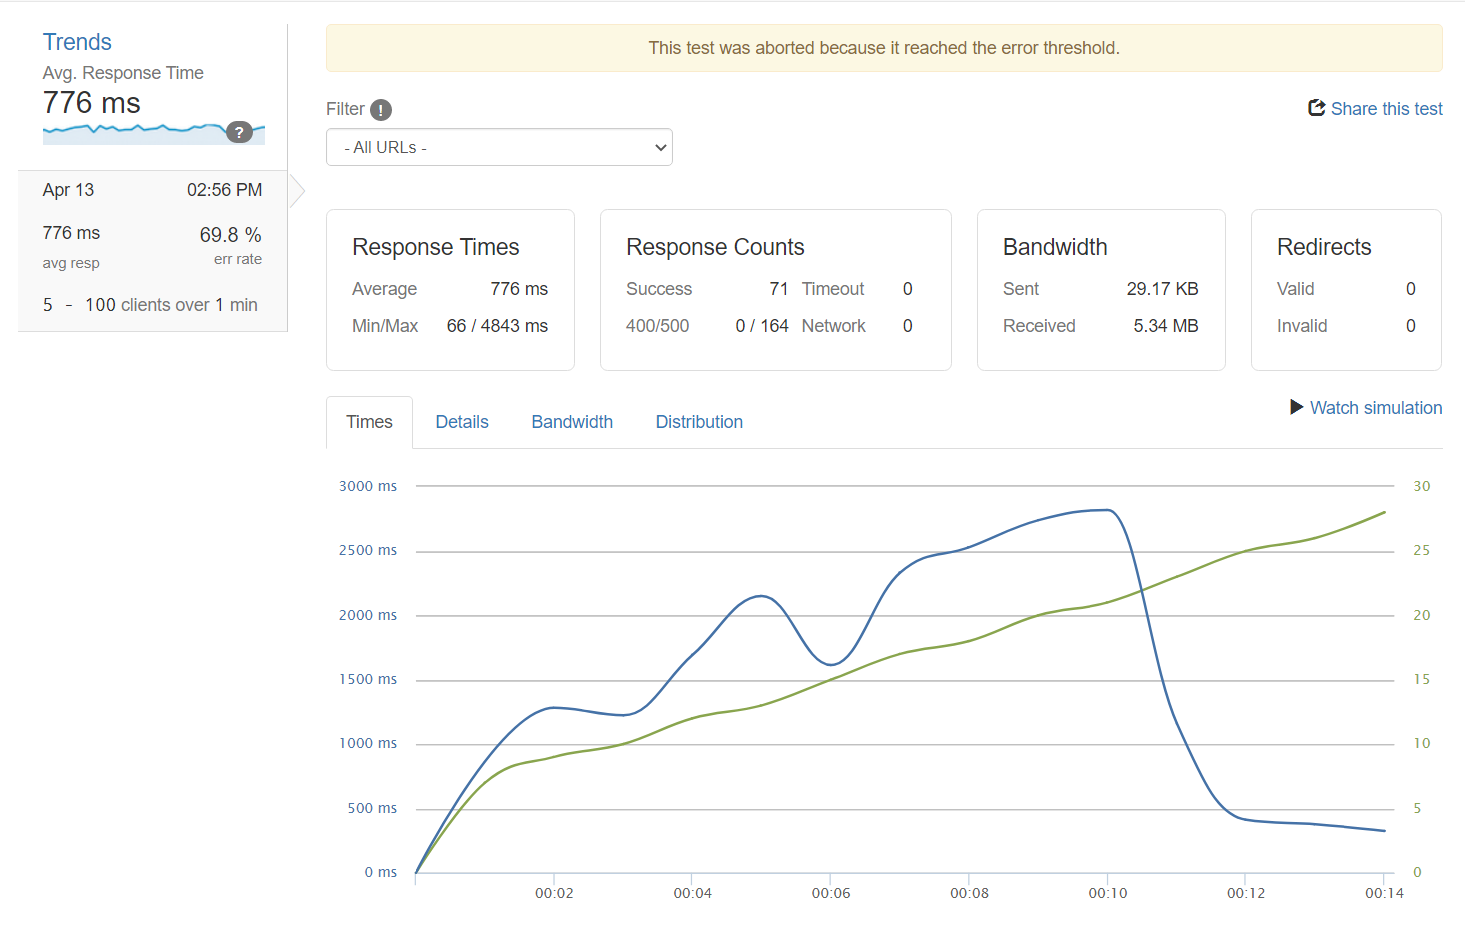
Load Testing with 5-100 Clients

Hi! I have been creating WordPress Website for 5+ years and create tutorials for beginners on my website and youtube channel.